Divergent Thinking
Table of contents
The System
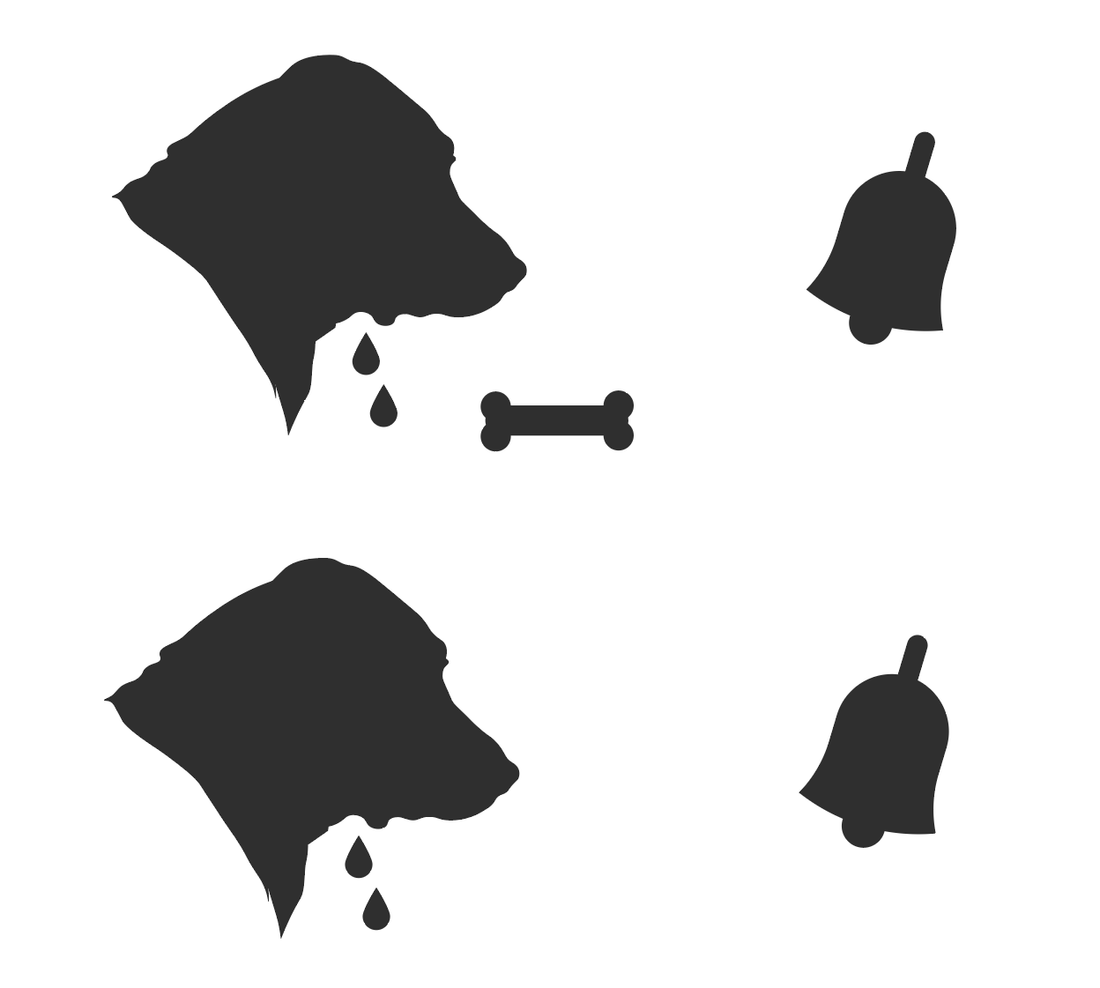
 The pure personal will may not exist: when we design or decode a visualization, are we really processing the information based on fact, or do we already have a personal impression before decoding the message? The flood of visual impressions and symbolic interpretations we constantly process condition our reactions and responses through repetitive association. Over time, our mental response may become a tool for others to manipulate unless we employ deliberate critical thinking to everything that obtains our attention. This complex thinking system is the ideology that exists in all of our minds even if we refuse to admit it. It is the ‘principle” or “law” we set up unconsciously to frame the decoding process which guides our judgment in the first place.
「游子」The Story of Chinese Students
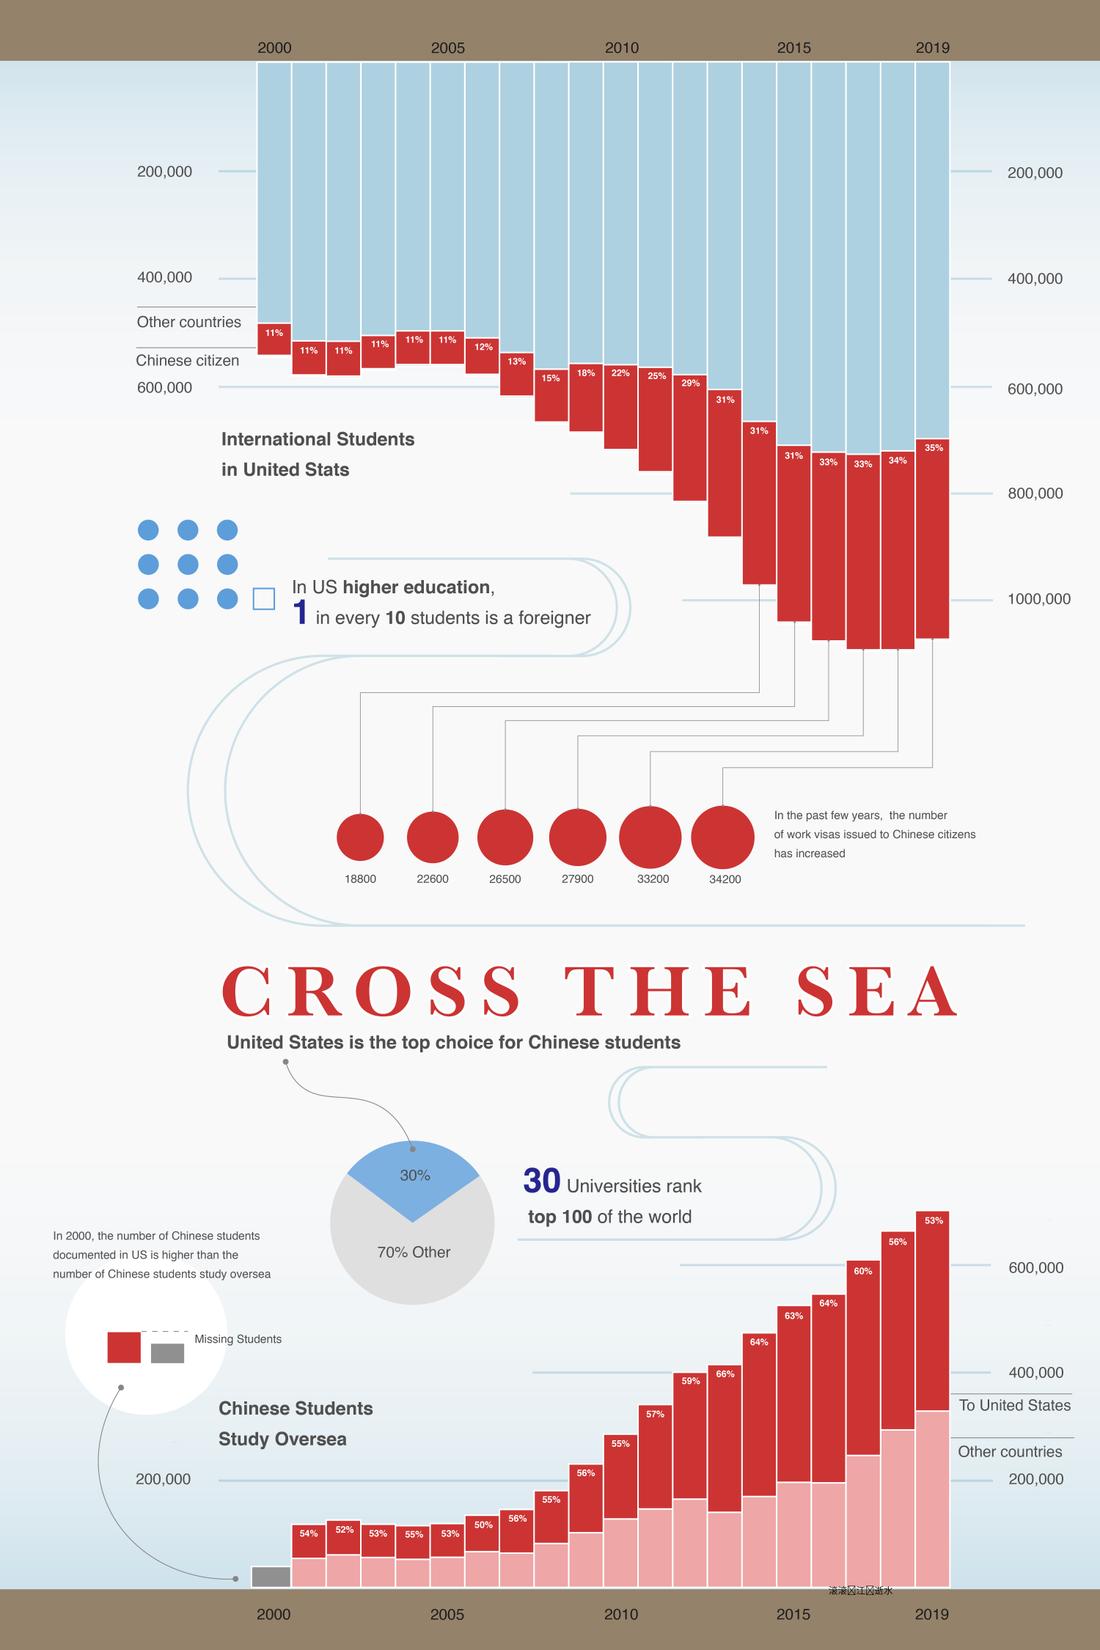
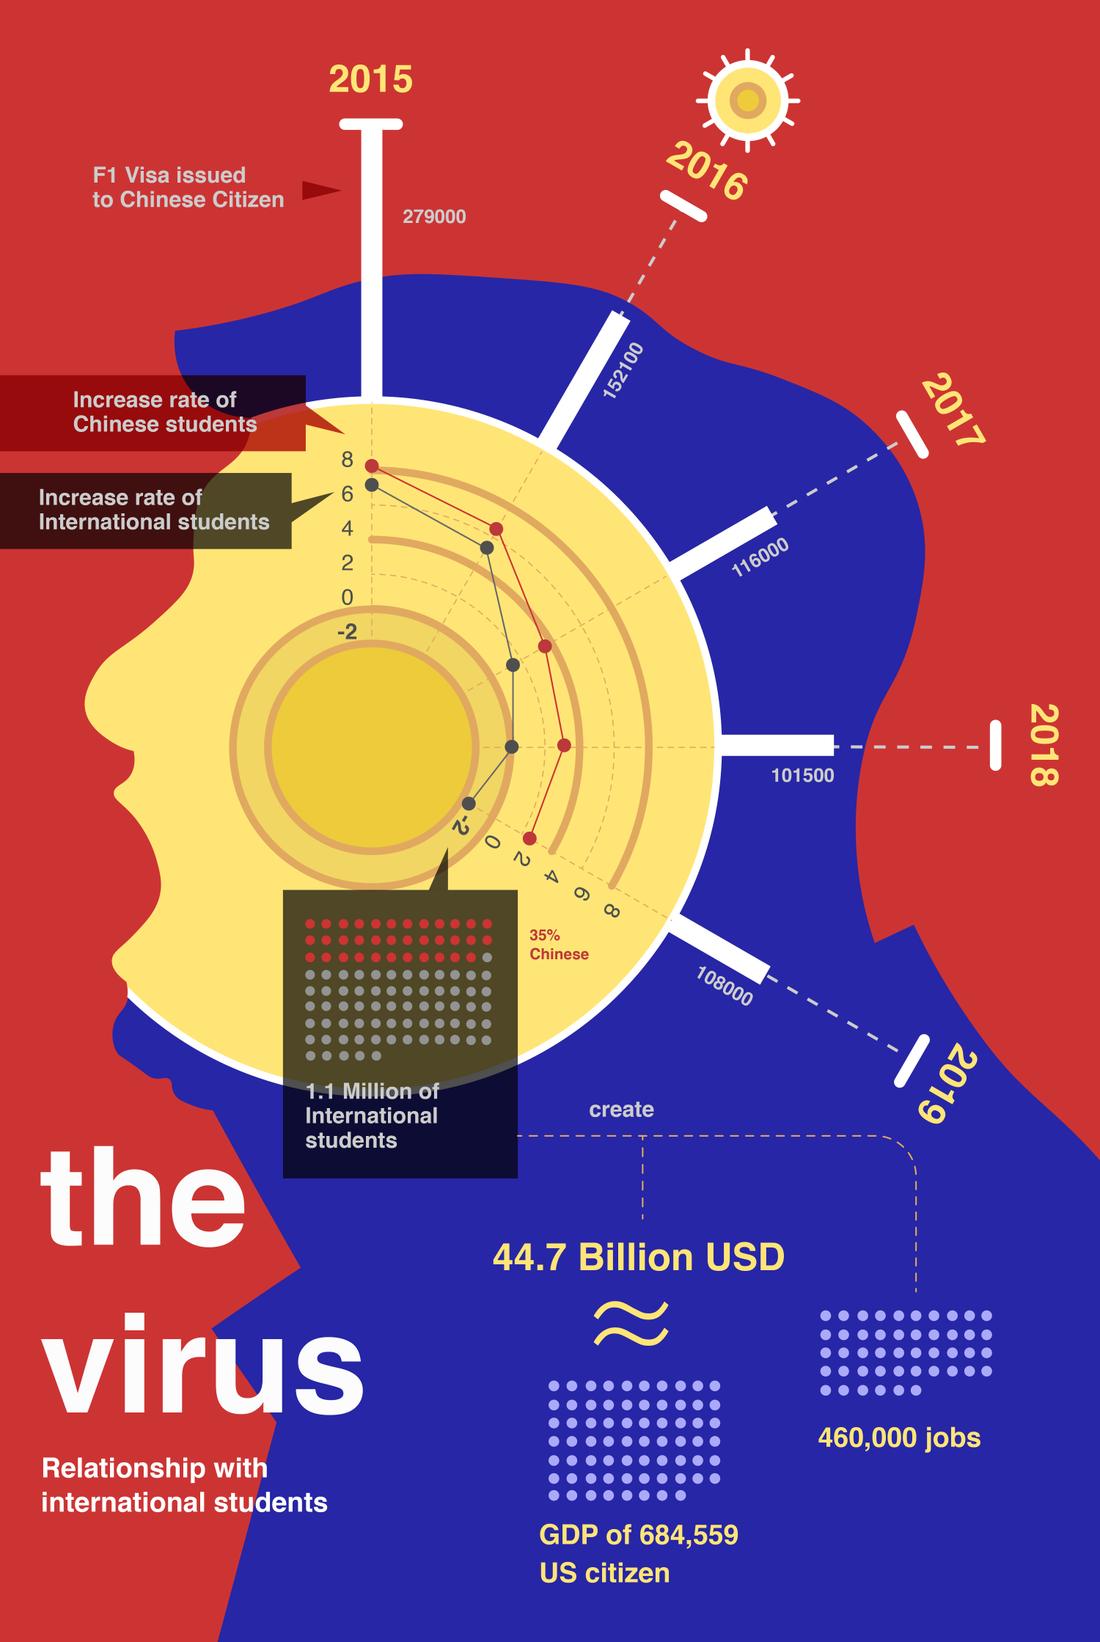
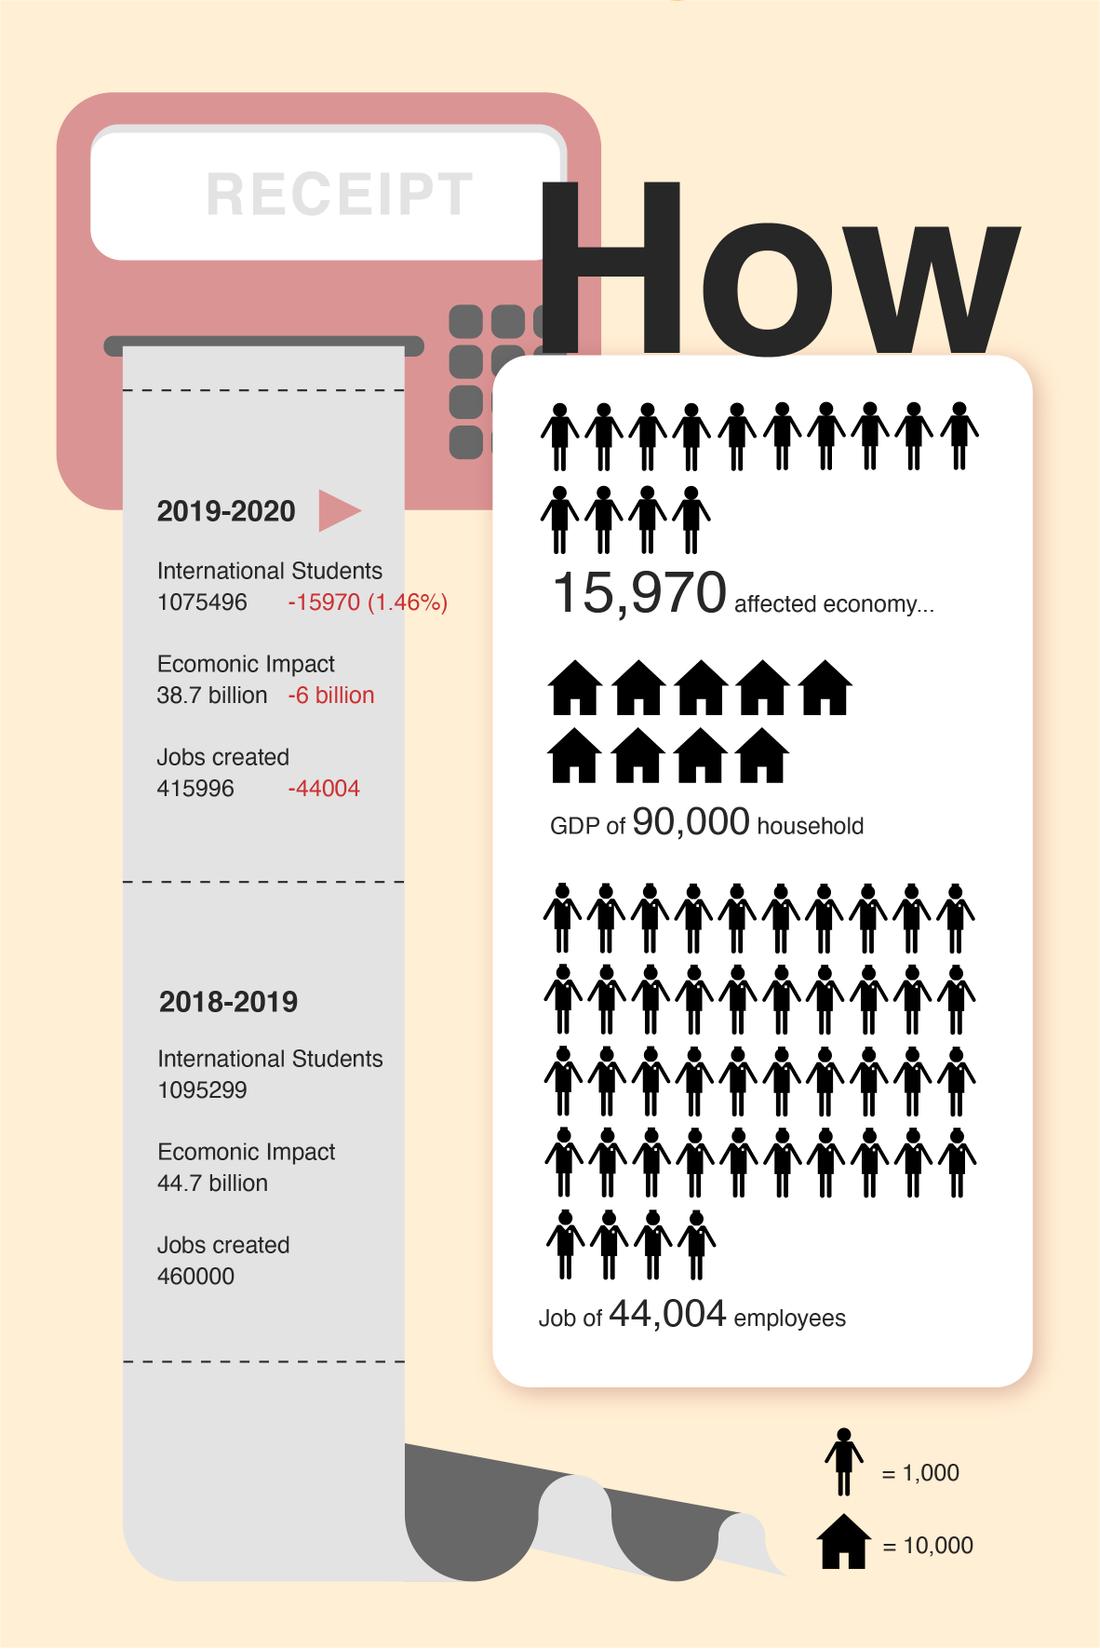
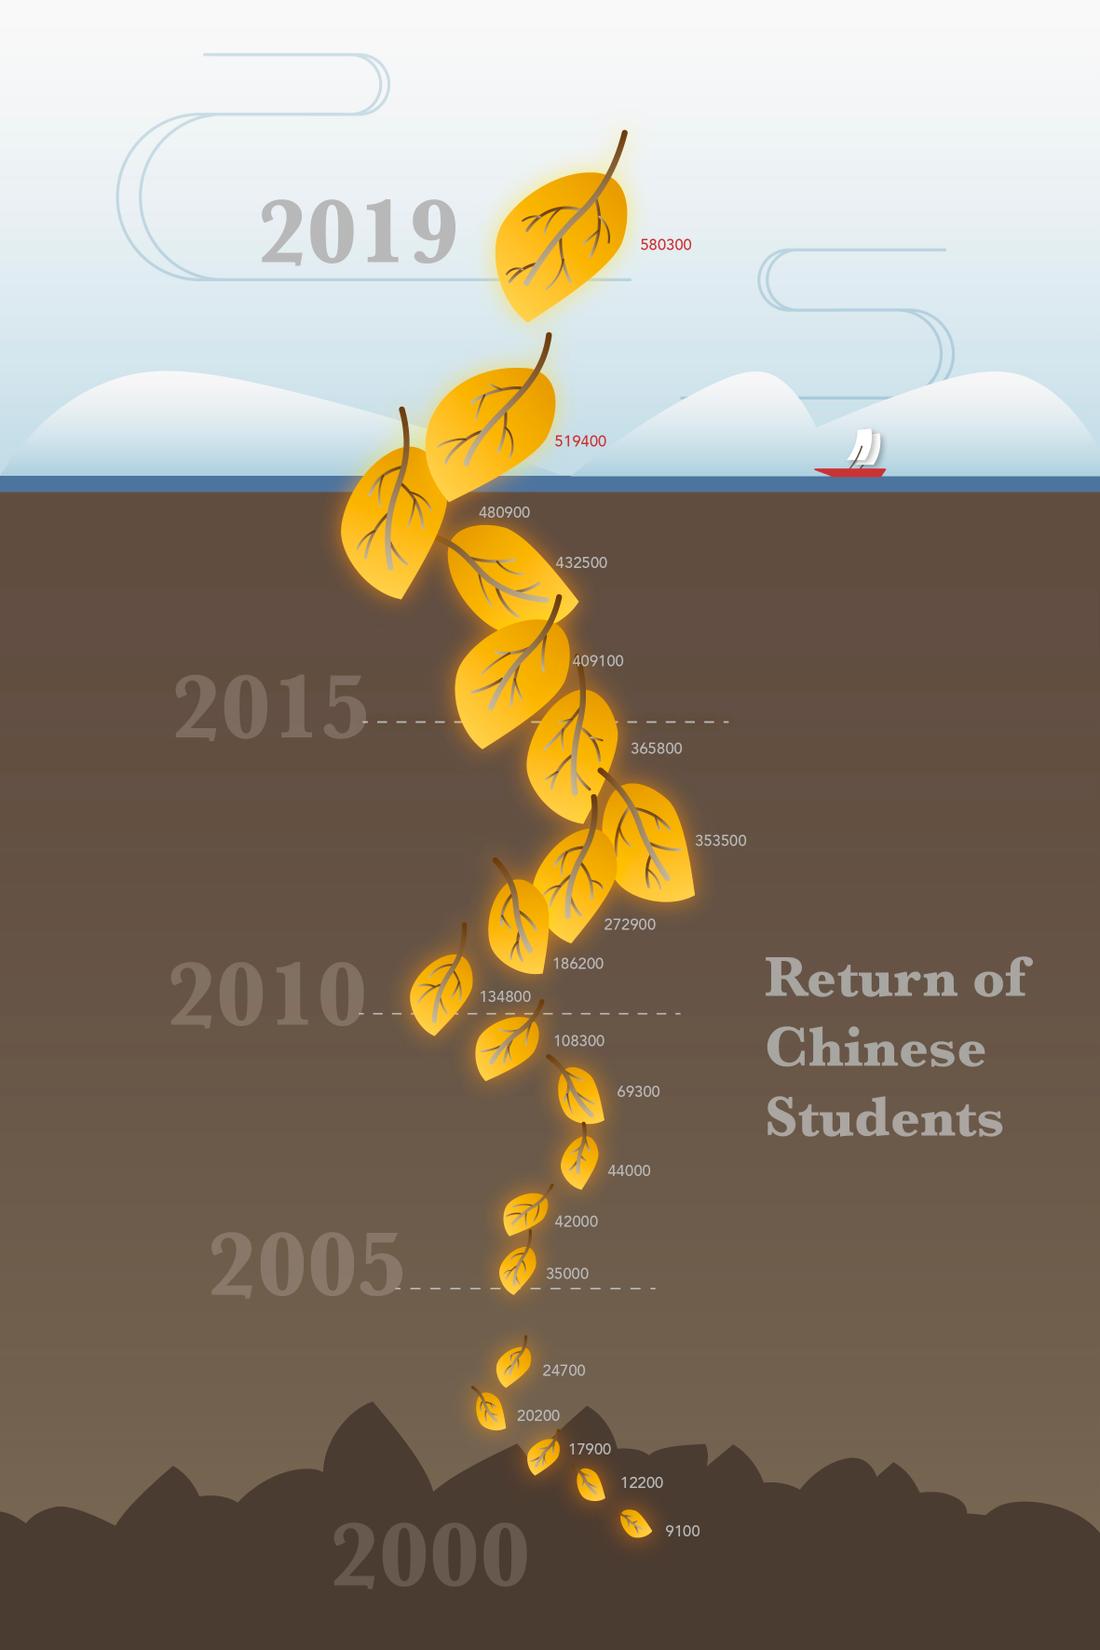
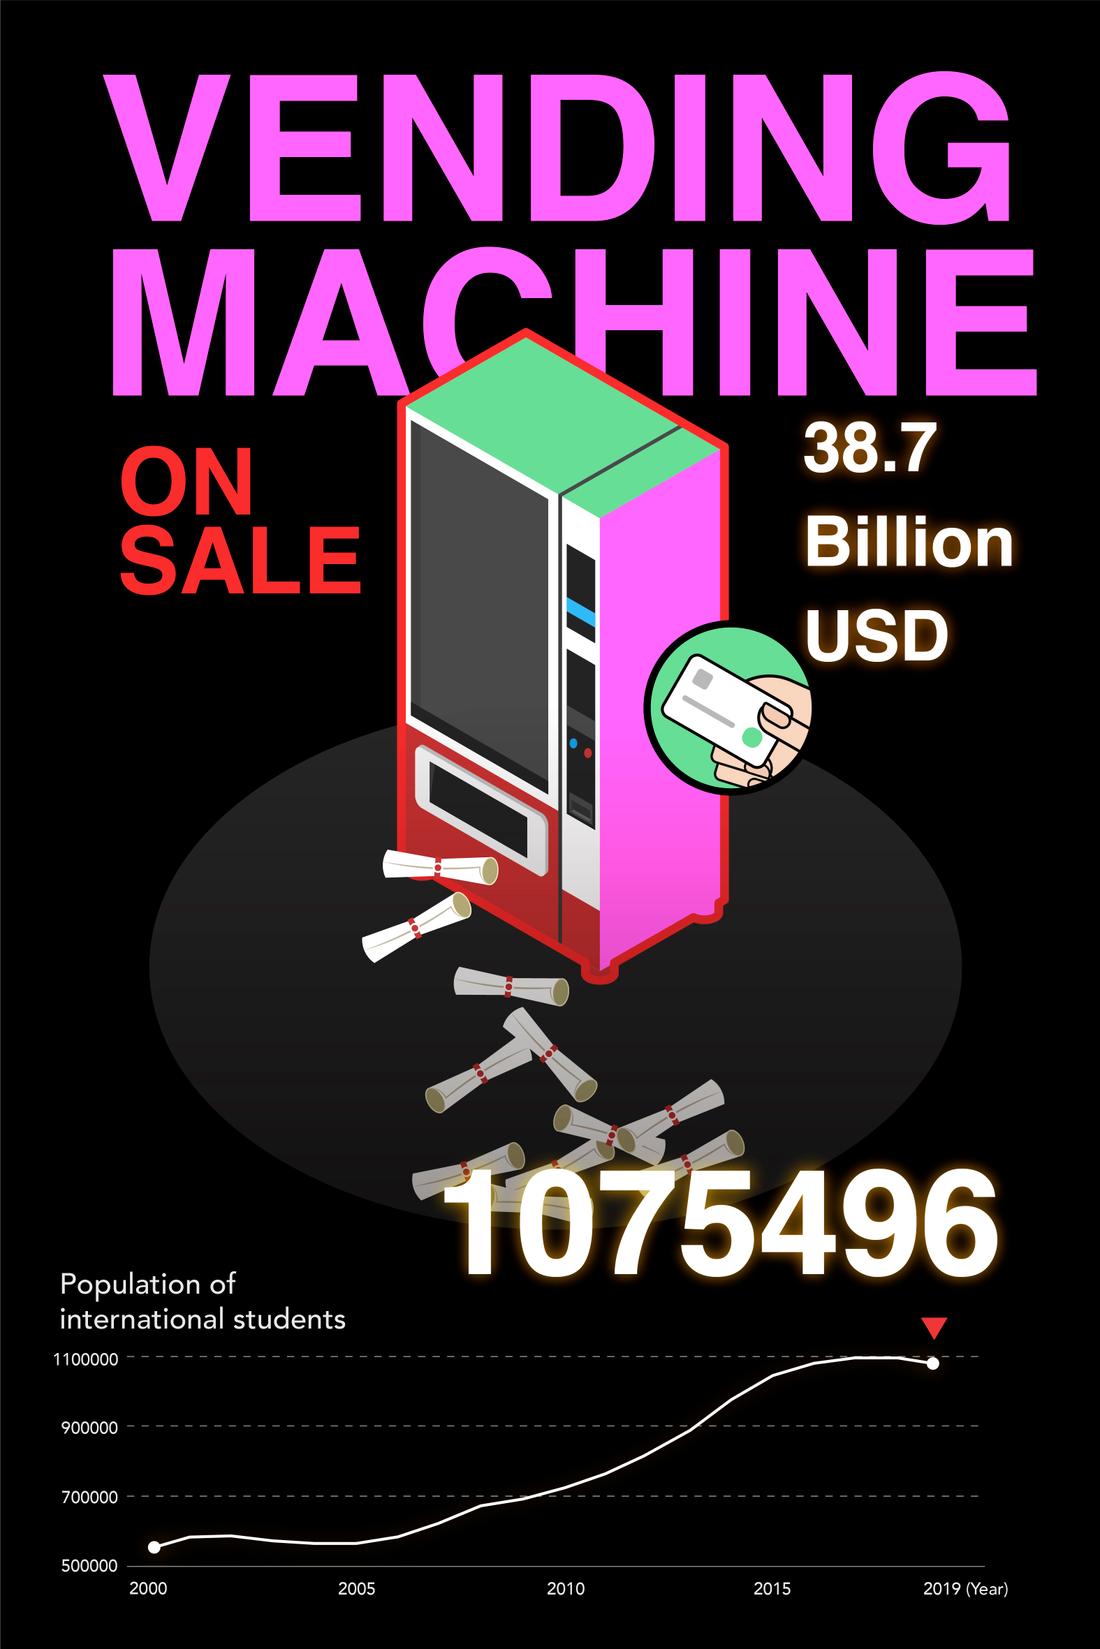
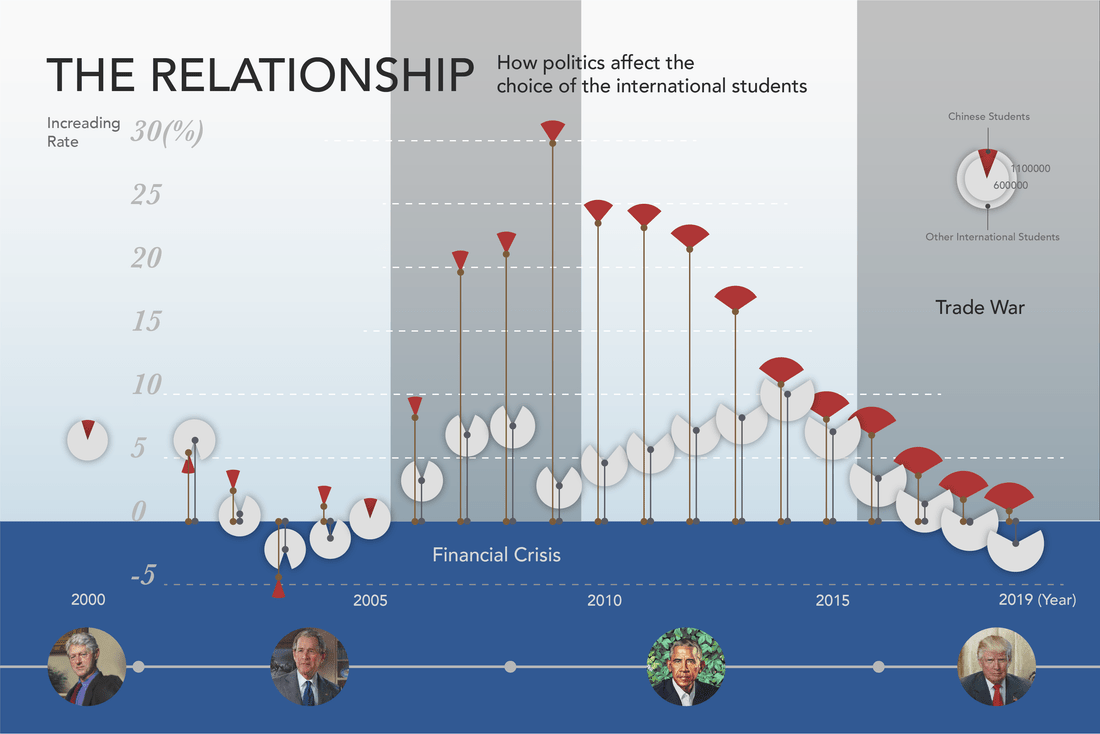
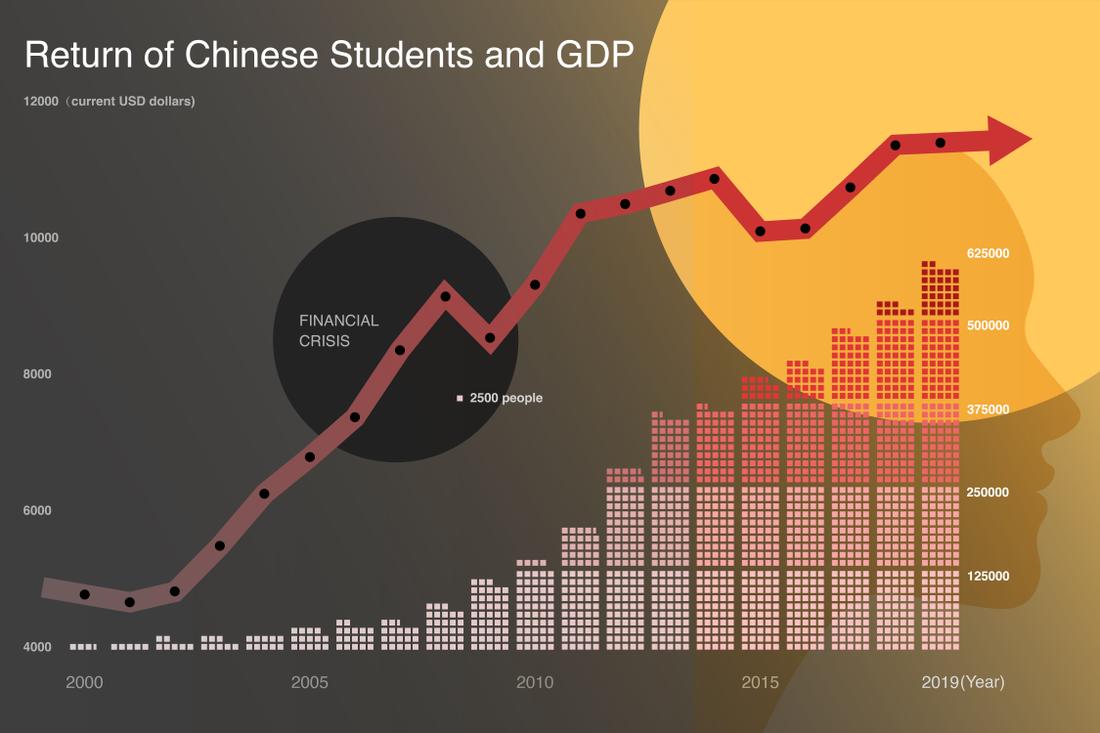
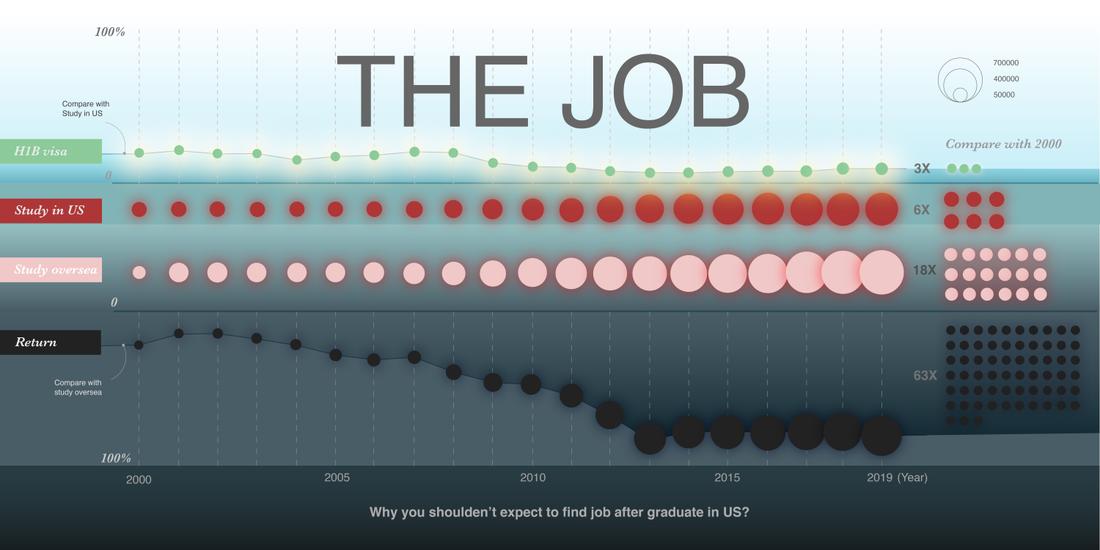
In the following sections, I compiled some important data about Chinese students studying abroad over the past two decades and visualized the data from multiple standpoints. My purpose is not to prove which view is the “truth.” As I have repeatedly emphasized throughout this thesis, the “truth” depends on an individual’s understanding of the information. In other words, the objectivity of data and data visualization is limited, and cannot represent the truth.

The Design
Conclusion and Future Directions
Our design has actually functioned as a medium to help people begin to process the information systems inside the brain in order to communicate. The goal of my thesis is not to point out one right method or find a “golden rule” for designers. The goal is to review data visualization from a perspective that might be commonly ignored before we lose interest in looks “cool” instead of being functional.
